Winter 2008
East Egg Moves West
– The Wilson Quarterly
Sociologists have explored virtually every aspect of the poor and middle class, but they are finally beginning to study the enclaves of the rich.
Social scientists havechronicled nearly every possible aspect of poor and middle-class neighborhoods over the last century. Finally, sociologists are beginning to probe one of the remaining under-researched territories of America: the enclaves of the rich.
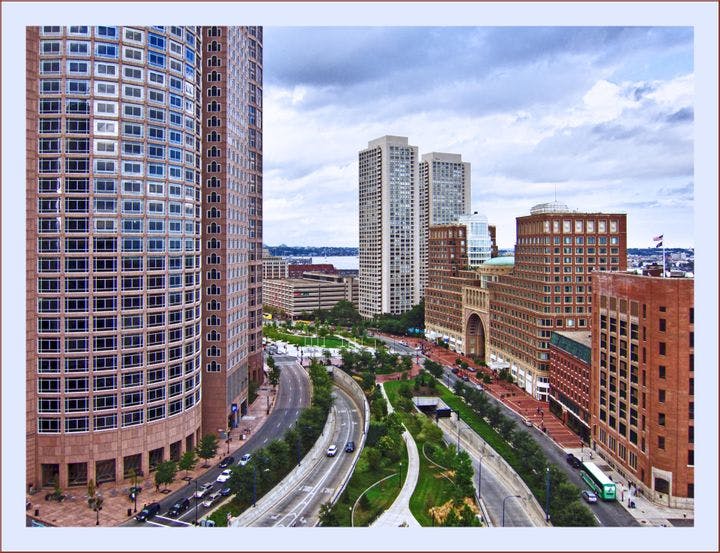
The comfortable class is hardly confined to the hedge-fund manager haunts of New York and the stately formality of Boston, where previous students have usually looked, write Barrett A. Lee and Matthew Marlay, sociologists at Pennsylvania State University. The well-off have moved to the suburbs. And to the West. In the most recent census figures, 30 percent of affluent neighborhoods—the top two percent of census tracts (each populated by about 4,000 people), with median family incomes of about $110,000 and over—are located in the West, 27 percent in the South, 26 percent in the Northeast, and only 18 percent in the Midwest. Nearly eight of 10 rich neighborhoods aren’t in central cities at all.
The flush communities are populated by families with children, for the most part, and about 88 percent of their residents are white. Roughly two percent are African American and about the same percentage are of Hispanic descent. Asian Americans, however, are overrepresented. On Main Street in a hypothetical Richville, eight of 100 residents would be of Asian descent, compared with five of 100 in Averagetown. About 13 percent of the households would be headed by somebody born in another country, compared with 14 percent for all communities. Nearly 70 percent of adults would have college degrees, compared with 26 percent overall.
Not too many full-time coupon clippers would live in these rarified reaches. Men in these census tracts would be more likely to be working than their counterparts in areas lower on the income ladder; women less likely. But most affluent households—70 percent—do report “unearned” income from interest, dividends, and rents, the authors write. Lee and Marlay were unable to squeeze out precise information on overall wealth—the oceanfront vacation home or the odd private jet—from the data available. But they did find that long before the current housing downturn, the top two percent of houses cost nearly $400,000, compared with just over $100,000 in the average sample census tract. The richest neighborhoods are not likely to be gated communities. Such developments are more often home to people some notches down the wealth ladder and worried about crime.
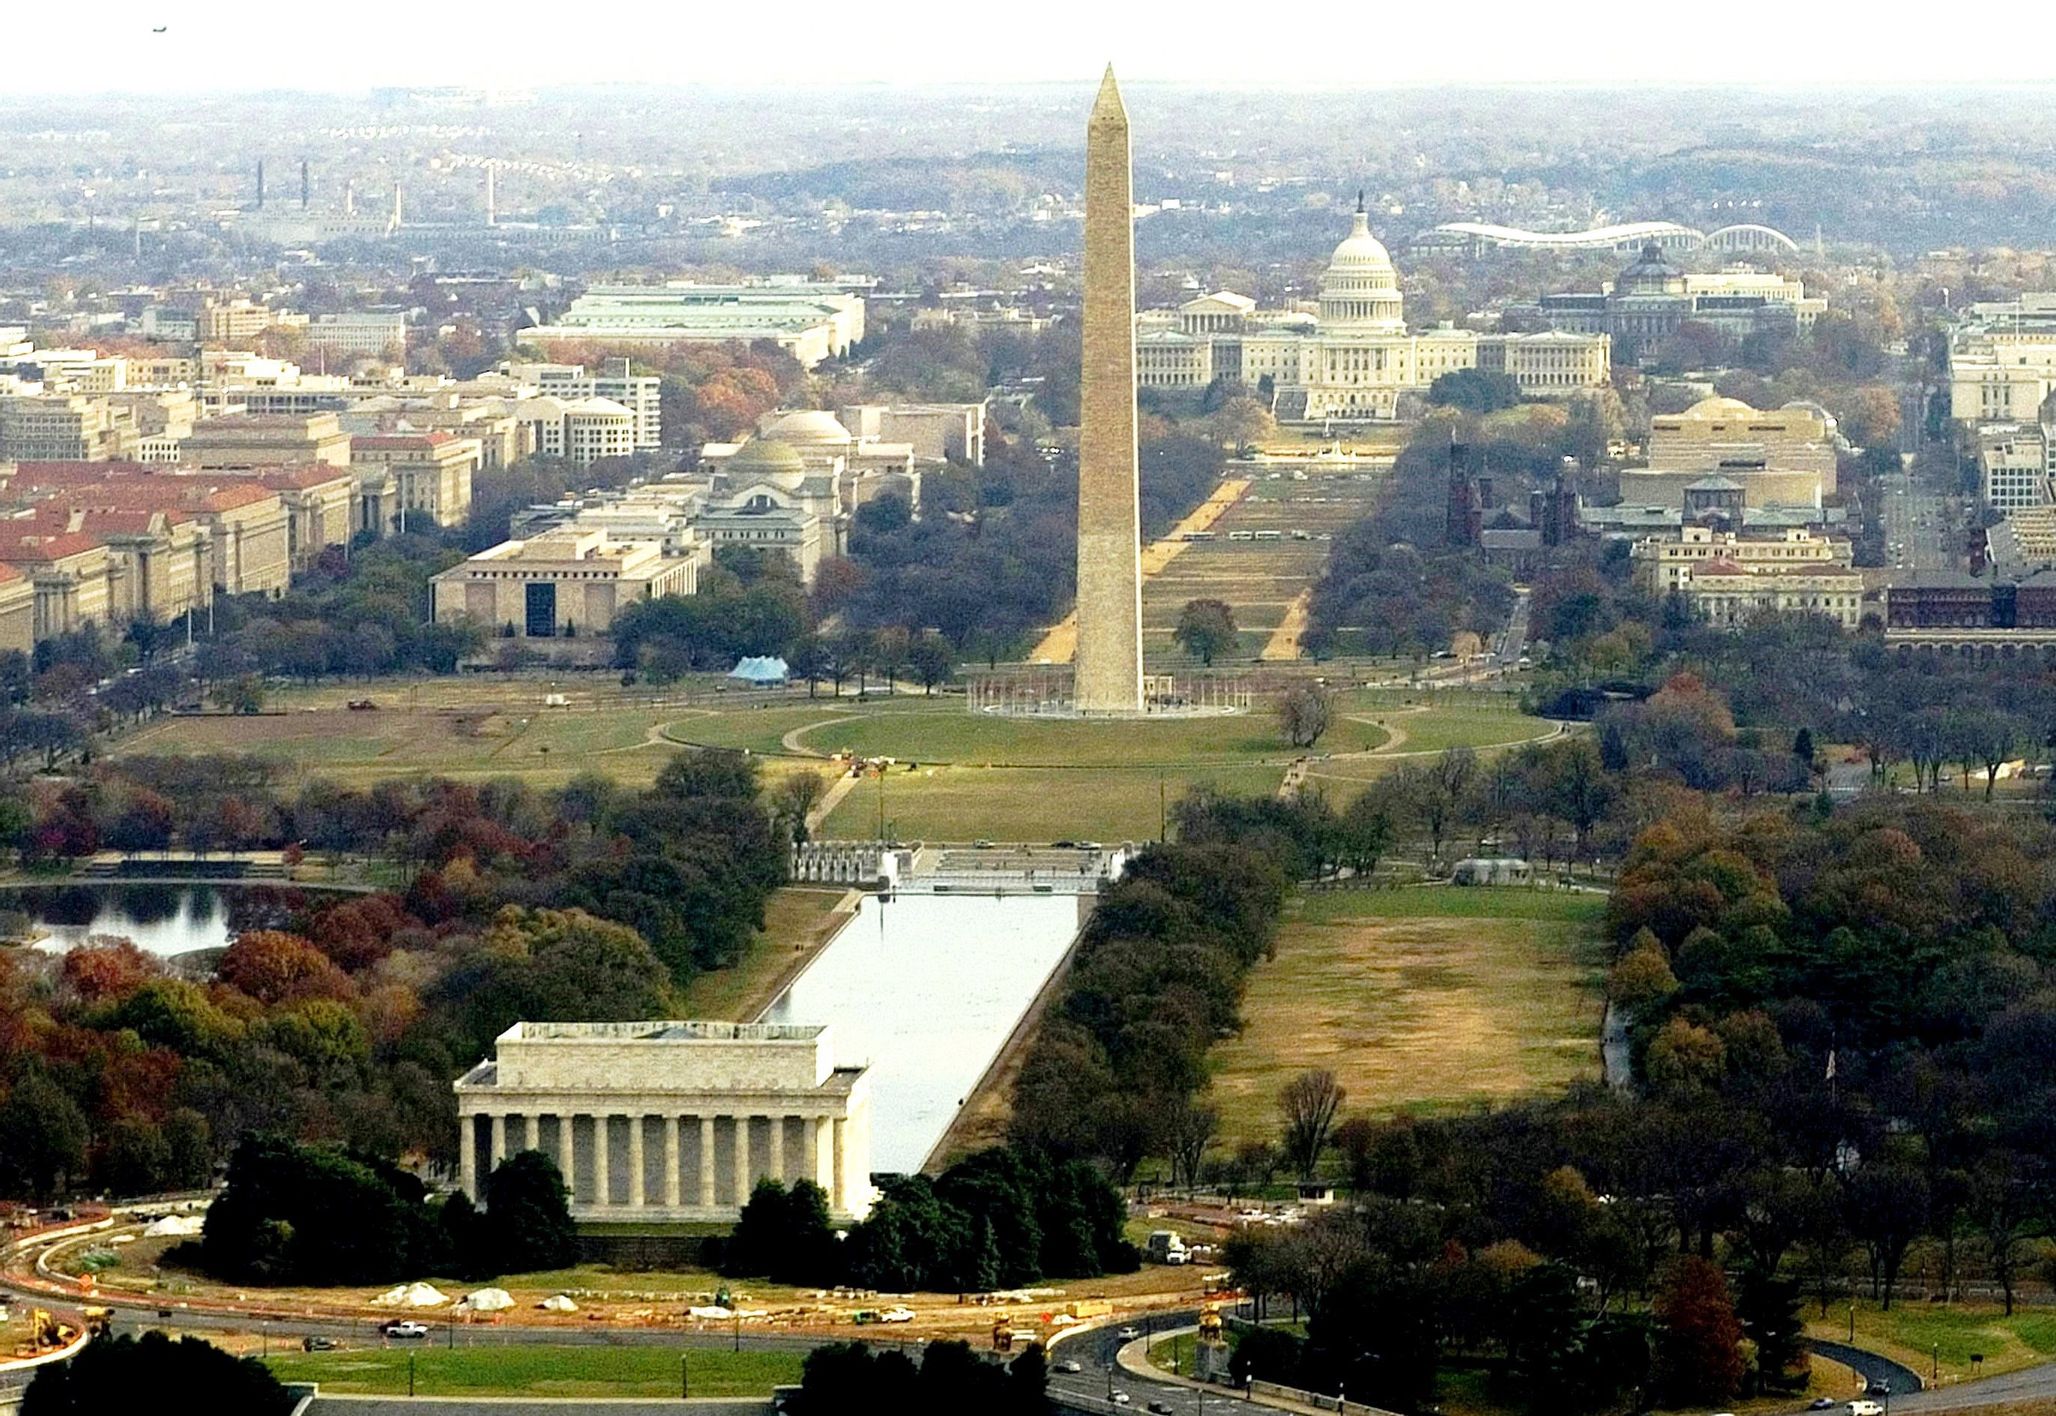
With a grand total of 74 wealthy census tracts, the Washington metropolitan area tops the list in terms of quantity. Metropolitan New York City is second with 54. Nationwide, there are 764 wealthy neighborhoods as defined by Lee and Marlay’s criteria. Interested though most of us are in how the other half lives, the authors note that the evidence produced by their statistical analysis is “rather predictable.” But the “modest surprises” offered by the authors’ research are somewhat comforting: Even the rich in America tend to hold down jobs, and a substantial number of them are first-generation immigrants.
* * *
THE SOURCE: “The Right Side of the Tracks: Affluent Neighborhoods in the Metropolitan United States” by Barrett A. Lee and Matthew Marlay, in Social Science Quarterly, Vol. 88 (3), 2007.
Photo courtesy of Flickr/Bert Kaufmann